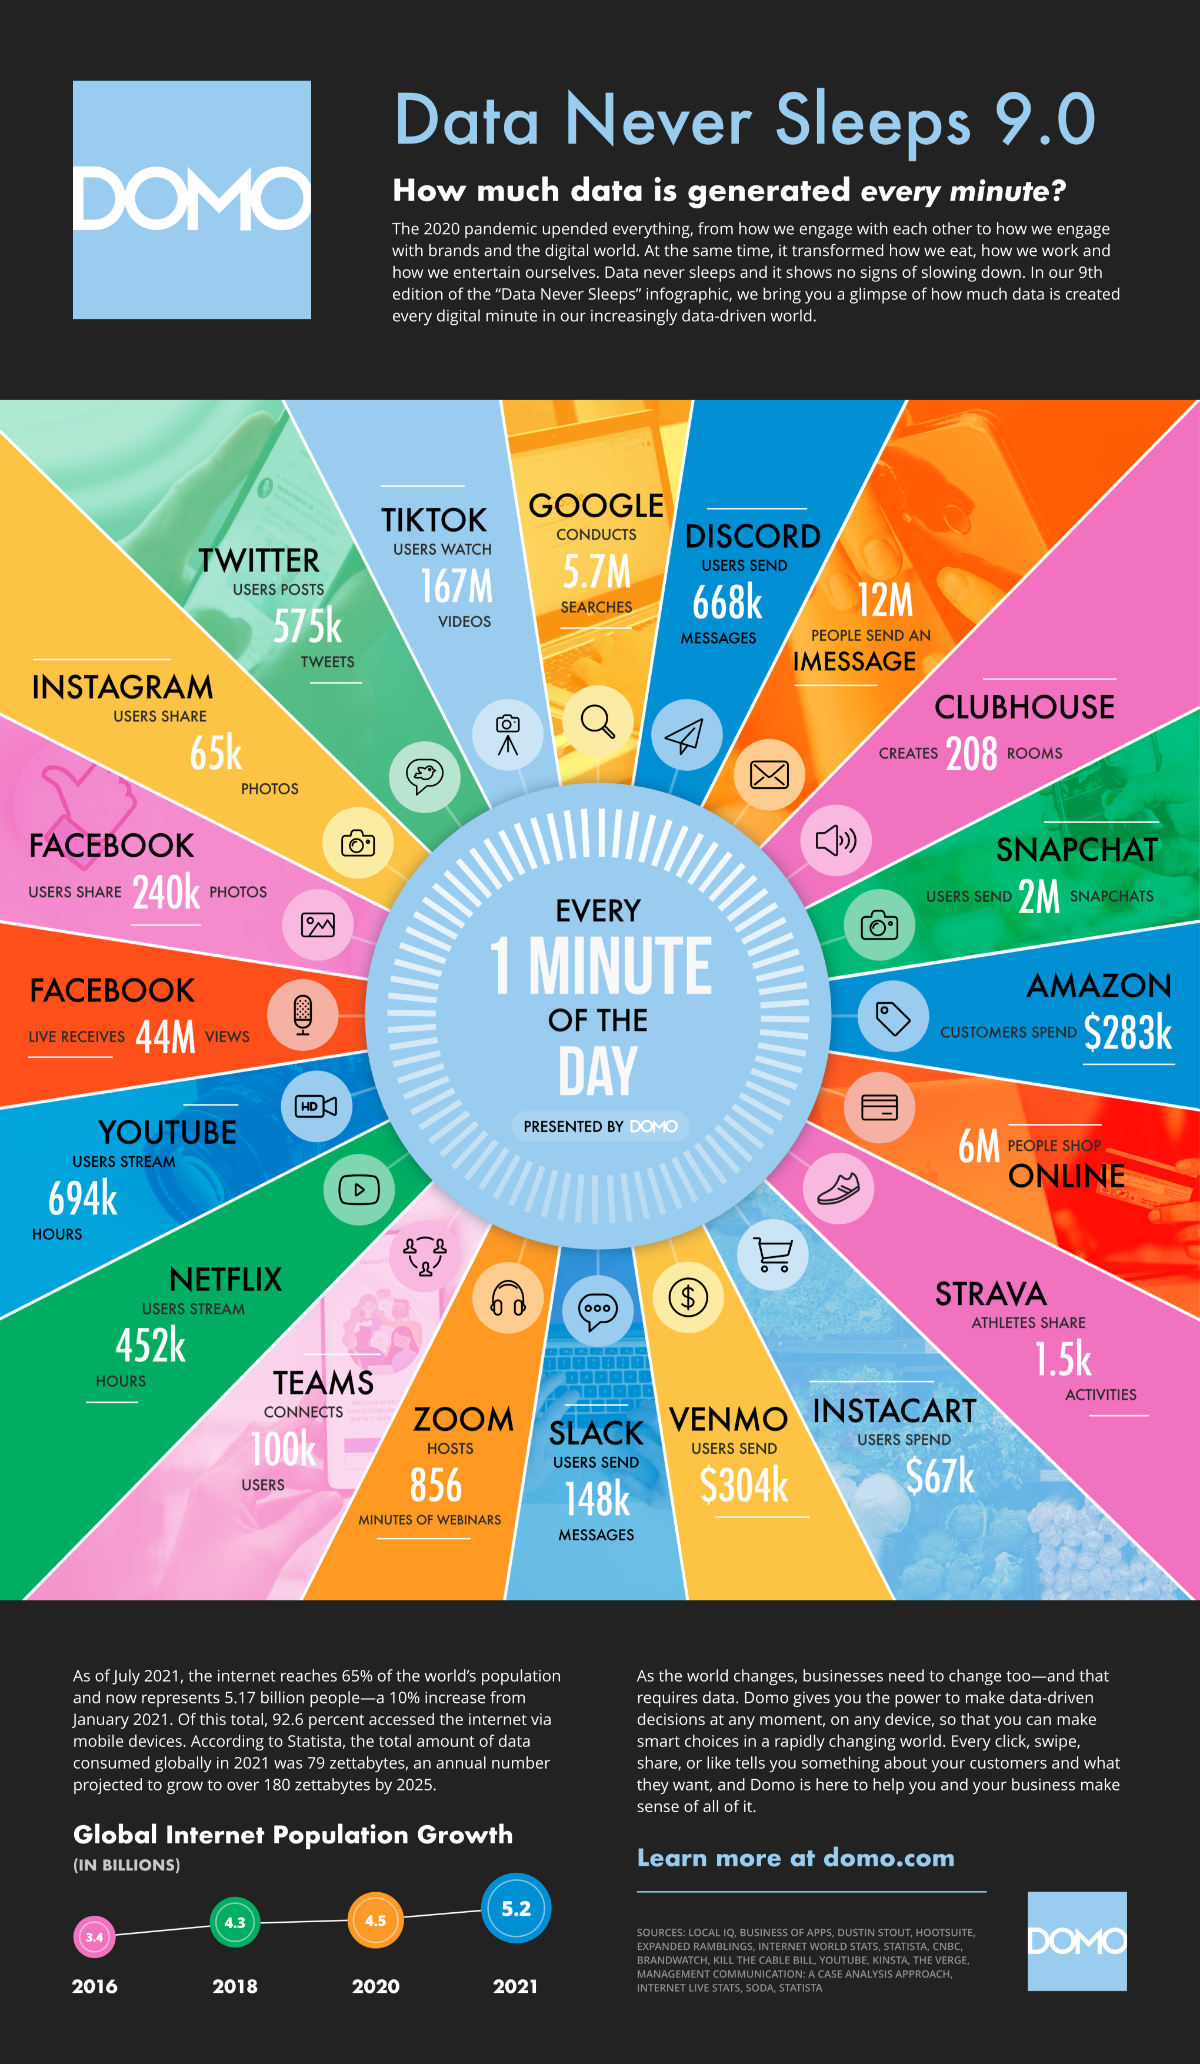


Domo has just released its annual infographic showing how we divide our time online every 60 seconds. With a pandemic-induced shift in digital trends, as well as a 10% rise in those with access to the internet, there are some notable changes from last year.
Still reeling from the Facebook, Instagram, and WhatsApp blackout?
Not as much as the conglomerates and billionaire entrepreneurs at their helm you’re not. They’ll be counting their lucky stars that this infographic came out before the outages.
We’re talking, of course, about the widely anticipated ‘Data Never Sleeps’ chart from Domo which is created during July and crops up around October every year.
If, in 2021, you’re new to the party for Domo’s ninth infographic, it assesses internet data minute by minute across our habitual activities. For lots of us, a quick look at the chart has become the easiest way of quickly establishing how our online behaviours are shifting.
For marketers, it obviously represents an opportunity to capitalise on new trends and generate big bucks. Who doesn’t love an accessible pie chart?
The stats cover everything: from our social media usage, how much we’re spending in ecommerce, how many messages we’re sending, how often we’re streaming, as well as analytics about the most visited apps.
The natural growth of internet users
Firstly, it has to be stated that the population of global internet users is growing every year. Up 10% from 2020, 5.17bn users consumed 79 zettabytes of data this year and projections suggest this will grow to 180 zettabytes by 2025.
As it stands, 65% of the world’s population is now online and with an extra 700 million users onboarded in 2021, you’d expect shared data, streams, and messaging to grow too.
This, indeed, is the case.
Coinciding with data showing that 96% of all internet users now prefer mobile, streams on TikTok rose to 167 million clips, and YouTube videos to 167 million clicks.
Take a look yourself at the various stats around some of your favourite activities, apps, and subscriptions – all the while bearing in mind, this is just 60 seconds worth.