Menu Menu
[gtranslate]

Climate action tracker shows where we are on net zero targets

With so many contributing factors, keeping track of exactly where we are on climate change mitigation is difficult. Thankfully, this new tracker provides accessible infographics on every industry and progress updates on their green objectives.

Researching how different industries are doing with their 2050 targets can be an arduous task. Take it from someone who knows all too well.

Worse than this is attempting to glean any real clarity on the whole picture of climate change mitigation. Between the alarming IPCC reports we get annually, there hasn’t really been any one place to monitor progress – or lack thereof.

From today forth, however, we’re excited to say this is no longer the case thanks to Speed&Scale’s new live tracker.

Back in 2021, the chair of VC firm Kleiner Perkins, Jon Doerr, went through the painstaking process of consolidating the best available climate data into a single book called Speed and Scale.

If you haven’t had the pleasure of reading it, this literary work breaks down the nuances of environmental policy and ultimately outlines an action plan for solving global warming.

Armed with information from leading experts like Laurene Powell Jobs and Cristiana Figueres, he outlines 10 action points – specifically, six on emission reduction and four on areas that need accelerating – to reach our 2030 and 2050 targets respectively.
Credit: Speed and Scale

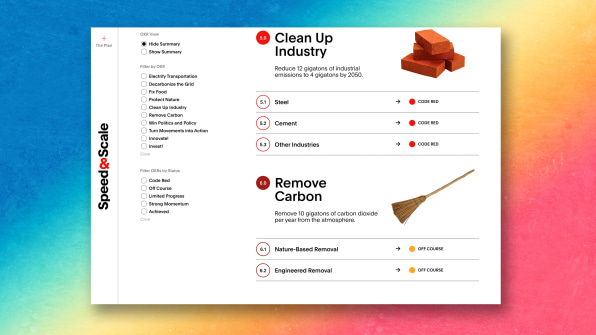
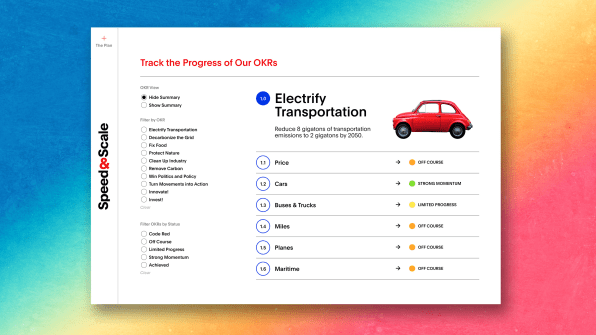
It’s this information that has been compiled into a nifty online format on the Speed&Scale website. Infographics break down the overview of each objective, such as β€˜Electrify Transportation,’ β€˜Decarbonise the Grid,’ β€˜Fix Food,’ β€˜Protect Nature,’ β€˜Clean Up Industry,’ β€˜Remove Carbon,’ etc.

Each has short lists of the most critical steps to take, both at an individual level and within companies, cities, states, and government. Transport, for example, covers aviation goals, phasing out combustion engines, and launching β€˜zero-ready’ maritime ships, among others.

What is particularly cool, is that these easily digestible tidbits have colour indicators from red through to green accompanying them to show whether they’re on course to match policy requirements or not.

A few results are moving in a positive direction, like the sale of electric vehicles. Meanwhile, deforestation and beef are denoted as two β€˜code red’ issues.

Looking at the big picture, experts worryingly state that fulfilling our current ecological policies will still see 2.8C of warming by the end of the century.

Credit: Speed and Scale

The co-creator of the tool, Ryan Panchadsaram, who previously worked on the Obama administration, revealed that it was specifically designed to aid business and political leaders in their bids to enact meaningful change. It’s all mapped out in a painstakingly straightforward way.

For those who simply want to cut through the waffle of politicians (like yours truly) it is particularly helpful too.

β€˜The idea was to help people see where the biggest sources of emissions can come from, and the measures that they’re really tasked with to move,’ he says.

β€˜The tracker is designed to encourage targeted actions. We like to say it’s about going for the gigaton. It’s about also leaning on collective might, not always just the individual piece.’

At its core, this website is there to galvanise people. At this late avenue, with vital deadlines approaching in the next decade, existential dread about the state of the climate will get us nowhere.

Hopefully, we can turn a few more of these lights green in the years following COP27.

Accessibility